Introduction
In this post we will analyze number vs. volume weighted distributions in a material composed by two different kinds of (synthetic) particles.
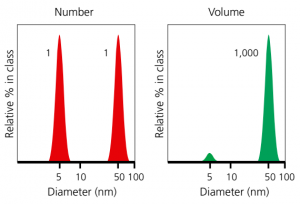
In the image on the left we can check the differences between number and volume weighted particle size distributions for the same sample. As the number weighted shows how material is composed by the same number of particles from each kind, the volume weighted indicates that one kind of particles is bigger (in volume) than the other. Unless both distributions are considered as equivalent by analysts, the volume weighted is the one that better clarifies the features of the final material.
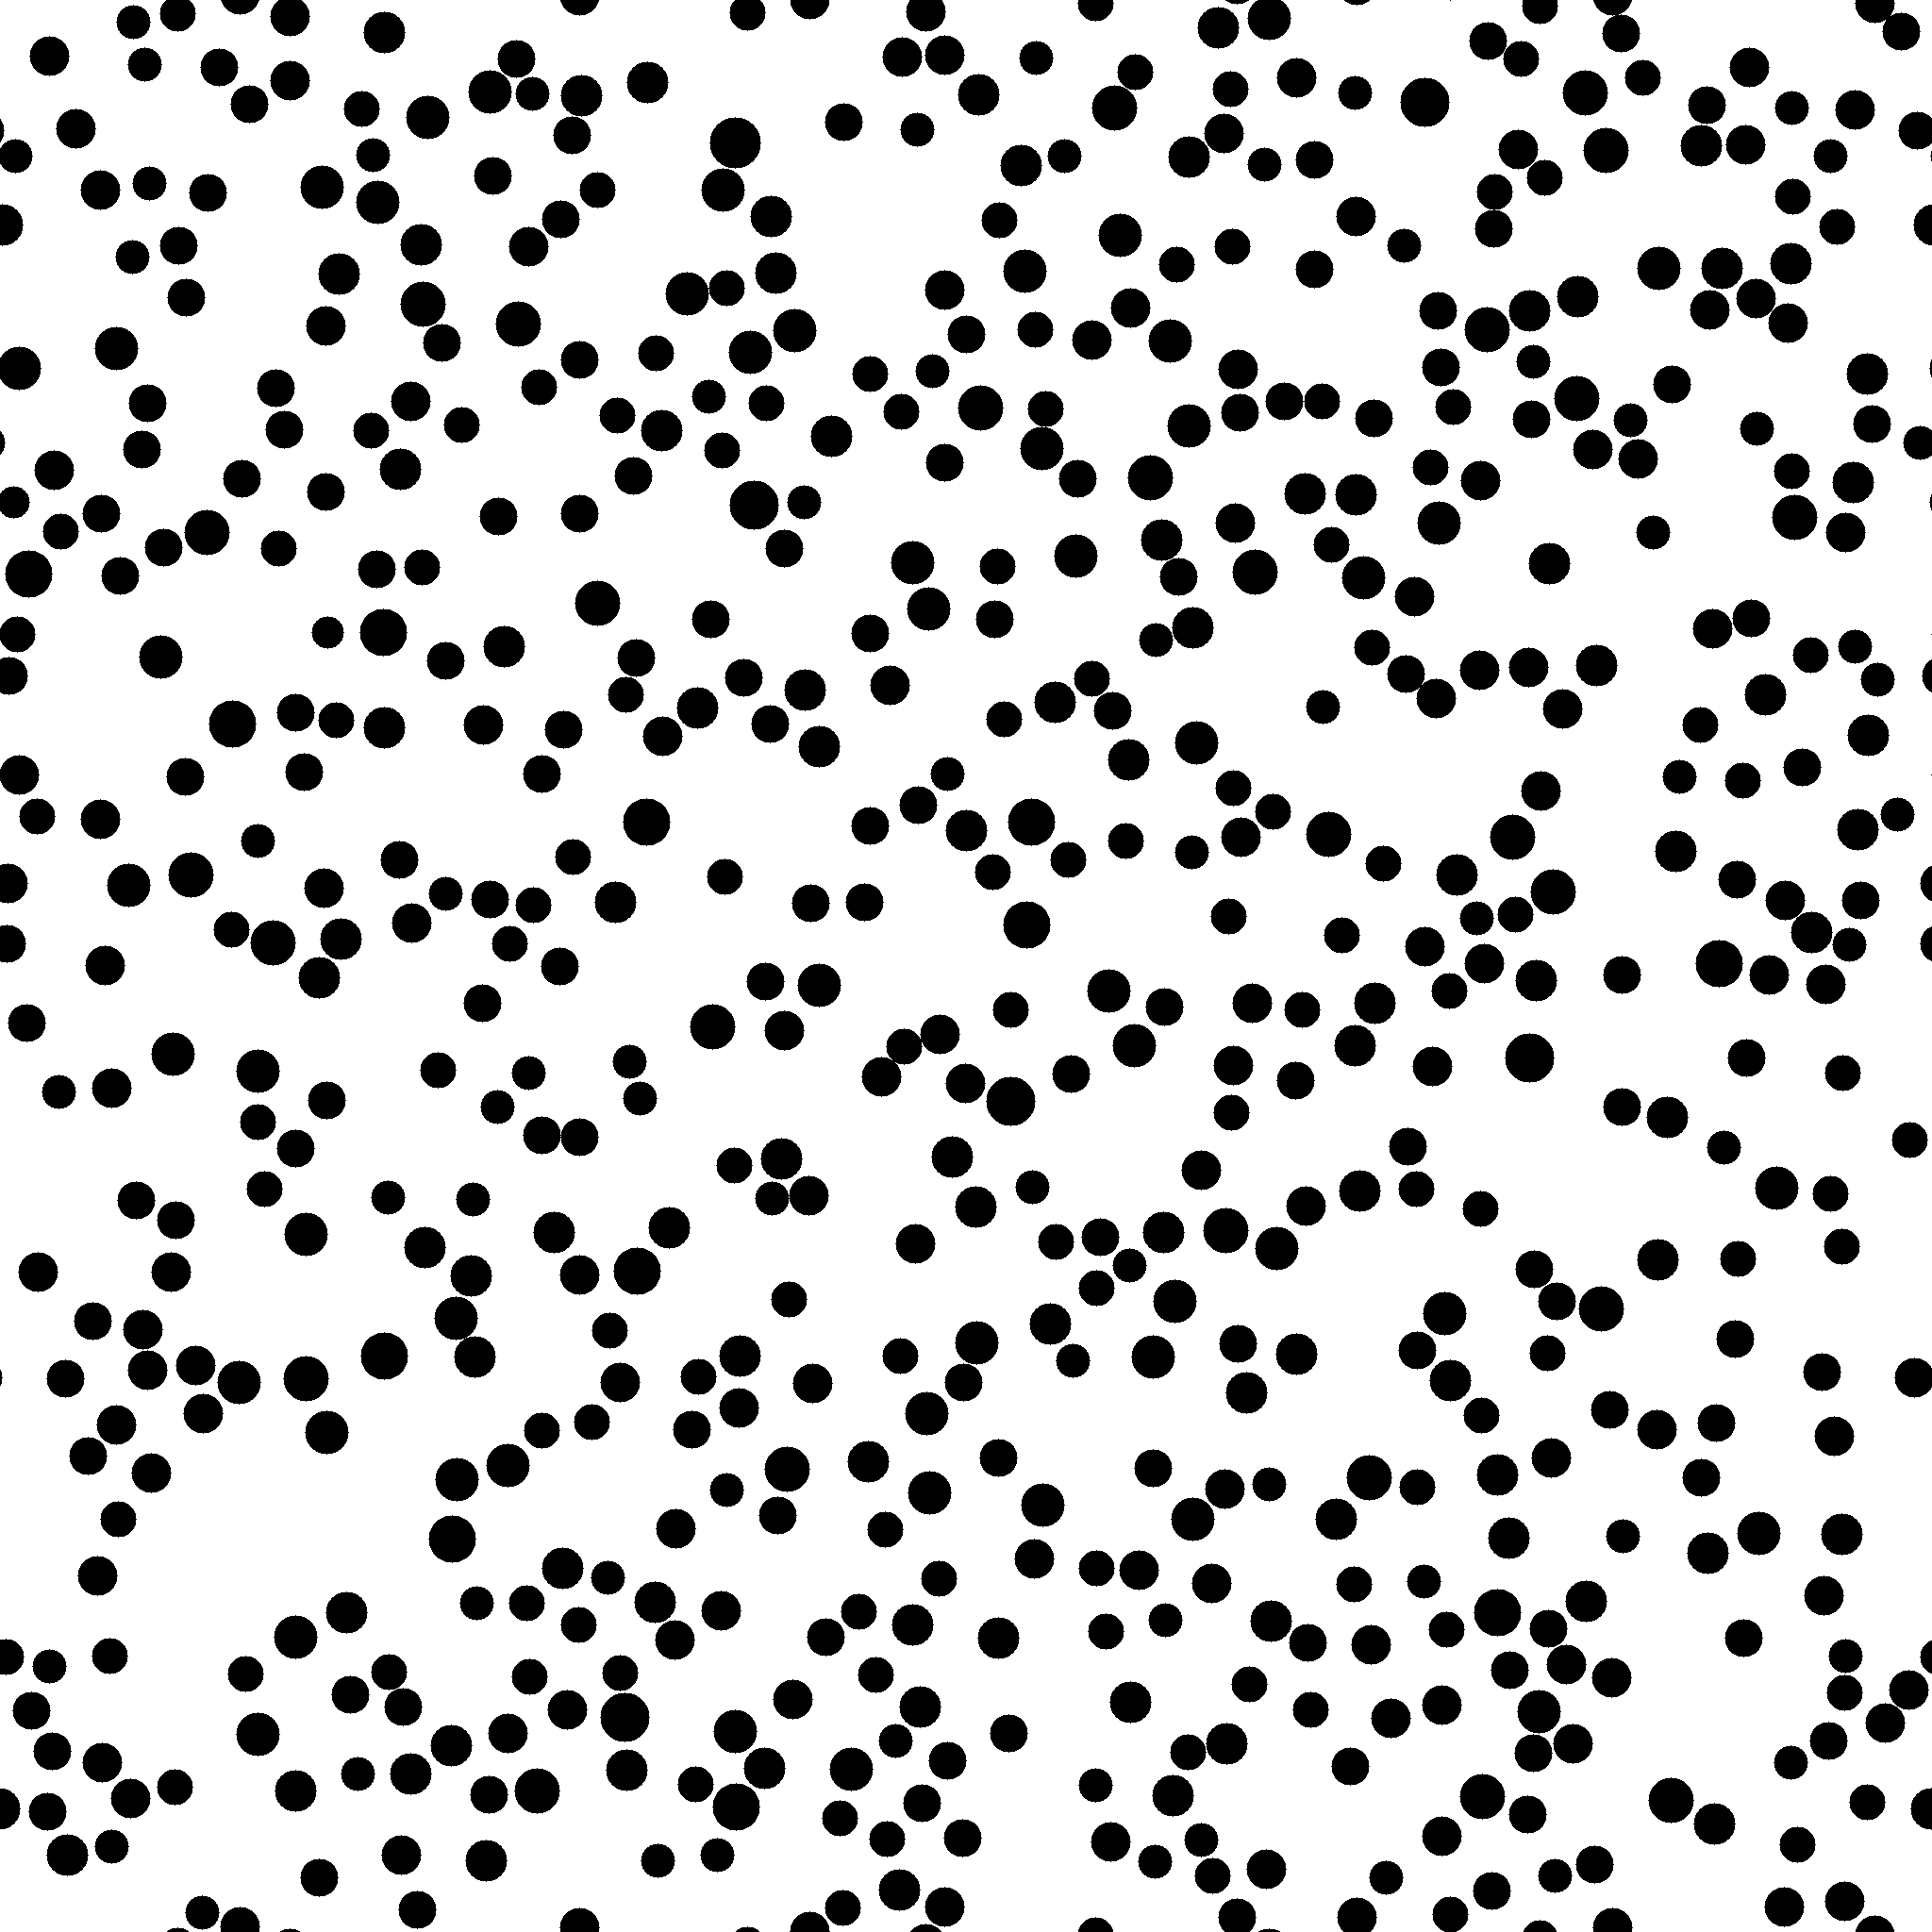
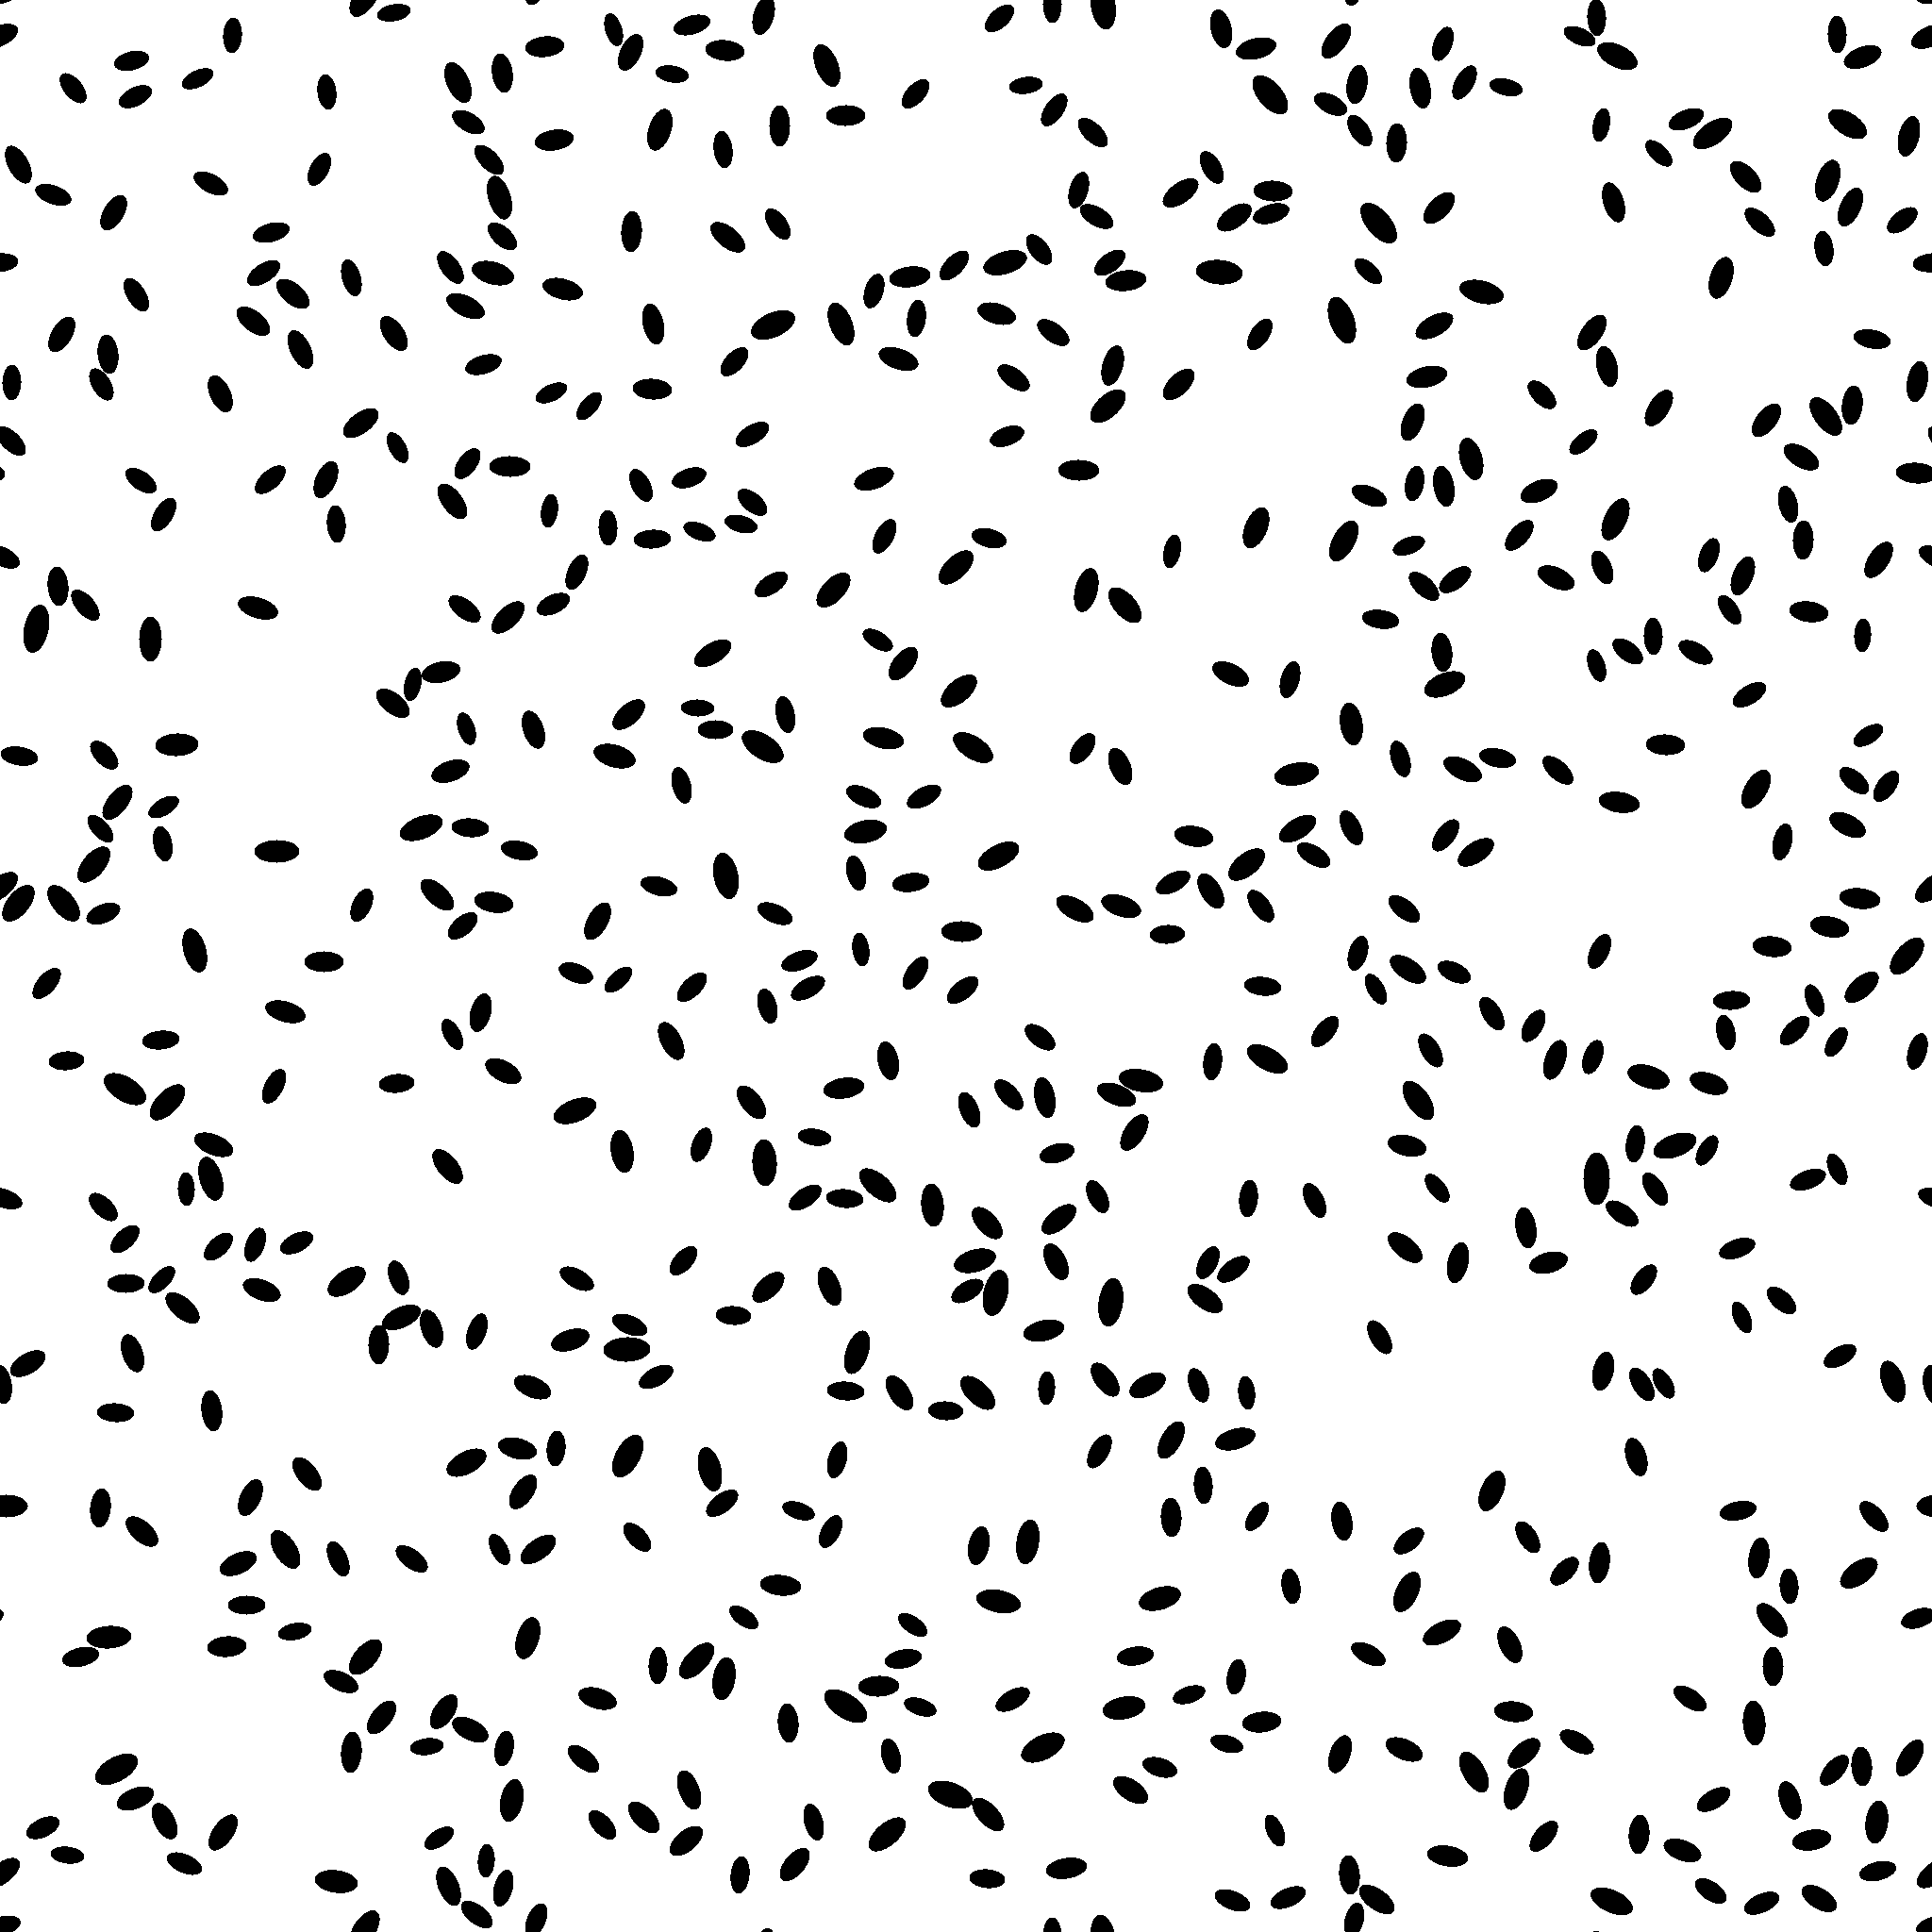
We generate synthetic samples with the Matlab’s tool presented and discussed in a previous post. We run the script twice, in order to obtain two kinds of microstructures with different shapes (spherical and elliptical). Differences in volume will be simulated later, with ImageJ scale settings. Both kind of samples are high resolution: spherical shape with a diameter of 40 pixels and elliptical shape with a major axe of 40 pixels (and AR=2). Volume fraction of particles is adapted to each shape (10% for elliptical and 20% for spherical shapes) in order to get around 600 objects by image (2048×2048 pixels). Common settings for both samples are the following:
- lognormal distribution of sizes with low variability (mean=1, sigma=0,1)
- randomly aligned
As a result of the samples generation process we get a first image with 625 spherical and a second one with 601high-resolution non-overlapped elliptical objects. In here you can check both, the numerical features of the individual objects (spherical & elliptical) and the sample images (spherical & elliptical).
As we have generated particles with different shapes, now (feature extraction step) we simulate differences in volume by means of different ImageJ scale settings. These scale settings are:
- spherical shapes: 40 pixels are equal to 5 mm
- elliptical shapes: 40 pixels are equal to 1 mm
Image processing (feature extraction)
With ImageJ we extract area, perimeter, shape descriptors (circularity or shape factor, aspect ratio, roundness and solidity) and Feret’s diameter. As objects on edges are excluded, a final number of 577 spherical and 572 elliptical particles are characterized. All this is ok but… what happens if we have outliers?
Outlier processing
Having a look on the image for the spherical particles sample we realize that, in some cases, neighboring particles are overlapped. The same effect is noticed with the elliptical particles sample. As we know from previous posts overlaps conduct to to outliers and outliers corrupt the final statistical results and hinder the interpretation of the physical properties of the material. Consequently, before starting with the statistical analysis, we should clean both files from outliers. To do that, take into account that all spherical particles have aspect ratio (or roundness) equal to 1. Also elliptical particles were generated with an AR=2. Unless the non-supervised outlier removal can be easily programmed in Matlab, for this case we do use just a manual inspection on both extracted features’ files. So, we manually delete all those objects that do not match with the expected values for the AR. The clean file for spherical particles contains 561 particles (16 outliers were detected and deleted). The clean file for the elliptical ones includes 567 particles (5 outliers deleted). Finally, we mix both files (we only take 561 elliptical objects) getting a final file of 1122 objects (561 of each shape/volume).
Statistical analysis for number weighted
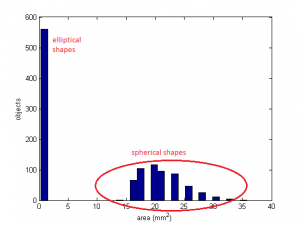
We process the previously generated file of features with the Matlab’s statistics toolbox. You can download the processing script from here. After the load of the features we can depict some graphs in order to check the number weighted distribution. As the statistical generation of both kinds of particles is the same but it is not its size, if we plot a number weighted histogram, elliptical objects will be assigned to the same bin (variability calculated on small sizes results on small variability in absolute terms). On the other hand, spherical objects are going to be dispersed in several beans (as you can check in the image on your left). Otherwise, if we sum the objects assigned to each group we get (as expected) 561objects by group.
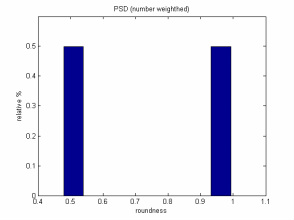
Another option to draw number weighted distributions is to use dimensionless features as, for example, roundness or aspect ratio. If we calculate the histogram (just 7 bins) for the roundness (spheres next to one and elliptical shapes next to 1/2) we can check how particles are assigned to two bins with exactly the same number of objects (561). An easy operation on the roundness vector let us to calculate statistical parameters for both bins (do not take into account the statistical value in the bar plot):
- roundness 1/2 (ellipsoids): mean=0,51 and standard deviation=0,013
- roundness 1 (spheres): mean=1 and standard deviation=0
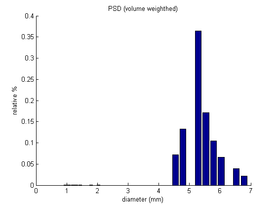
When the important issue is to know the composition of the sample in terms of its volume/mass (instead of the absolute number of particles) we use the volume weighted distribution. This is often extremely useful from a commercial perspective as the distribution represents the composition of the sample, and therefore its potential value. In this example, the number weighted distribution reveals how the number of particles of one kind are equal to the other but… how about their contribution to the volume of the final material? Just having a look on the section for the sample presentation, we can realize how dimensions of spherical particles are much bigger than ellipsoids. When we represent (see graph) volume weighted distributions, contribution of ellipsoids seem not to be relevant in the final composed material. This is coherent with the scale settings used, where spherical particles present a diameter 5 times bigger than the elliptical ones. This difference is increased to the 3rd power due to volume calculations. You can download the script with this calculations from here.
Number weighted distributions are not always the best way to reveal material composition. As this technique can be very useful (for example) in foreign particle detection, the most of the times it is better to present a volume weighted distribution due to economical interests (how much material of each kind we use for the composite). Once the individual particles have been featured the transformation between number and volume distributions is not difficult at all.
- Malvern Instruments Limited, «A Basic Guide to Particle Characterization», 2012
- Horiba Scientific, «A Guidebook to Particle Size Analysis», 2012