The EEMlab project (Excitation Emission Matrices laboratory) consists on developing a MATLAB’s Graphical User Interface (GUI) that fully supports the drEEM toolbox (decomposition routines for Excitation Emission Matrices). The join of both, the EEMlab GUI plus the drEEM toolbox enable the researches an easy way to perform PARAFAC analysis onto fluorescence EEM datasets. This project is structured in sever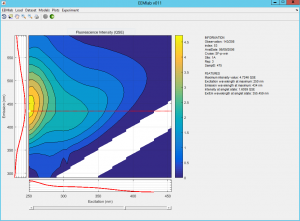 al parts:
- the PARAFAC processing core, fully developed in the drEEM toolbox [1, 2]
- the drEEM-EEMlab interface functions and helper scripts to support the new functionality
- the EEMlab GUI developed with MATLAB’s GUIDE
The EEMlab Project enables the direct load, correction, preprocessing and PARAFAC modeling of the EEM datasets. The models can be validated using the Split Half Analysis. EEMlab also enables a variety of plots and graphs that make easy both, the manual inspection of the dataset and the interpretation of the results derived from the PARAFAC models
Downloads
The last 0.29 version of the EEMlab bundle is publicly available on April, 2023. You can download it directly from this site. A detailed paper describing the EEMlab project and its functionality was also published on March, 2019 [3]. This new download includes the full EEMlab bundle (developed and tested with MATLAB R2021a) with the drEEM processing core and a new v0.29 GUI. You can also get the files for an example dataset to work with and the EEMlab operating tutorial. This new version improves the EEMlab GUI with the following updates:
- it’s been adapted to the Mac OS
- the extraction of the correspondent Raman scan directly from the EEM
- a plugin to load datasets from Aqualog, Varian Cary Eclipse, Jasco and Hitachi fluorometers
- a plugin to load absorbances from Agilent 8453 and Jenway 7315 spectrophotometers
- a new tool to downsample corrected EEMs before PARAFAC processment
- a new step-by-step EEM DOM correction algorithm
- the new EEMlab loading procedure for standard CSV formatted EEMs
Click on the desired link to get the correspondent download. And please, remember to fill the following REGISTRATION FORM:
- the EEMlab BUNDLE that includes the v0.29 of the EEMlab GUI with the drEEM processing core.
- the drEEM EXAMPLE DATASET
- the RESULTS for the drEEM example dataset processed with EEMlab
- the authors’ EEMlab DATASET
- the EEMlab TUTORIAL that illustrates how to use EEMlab to process the drEEM dataset
- the new EEMlab loading procedure for standard CSV formatted EEMs
Acknowledgements
Please, fell free to contact us if you have any problem on working with your datasets. Thanks to the people listed below we can keep on improving the EEMlab Project!
- thanks to G. Gold Bouchot (Texas A&M University, United States) for providing us feedback about the EEMlab and a new dataset to develop a plugin for the Aqualog fluorometer
- thanks to A. Hechavarria (Universidade Estadual de Campinas, Brazil) also for the feedback with the EEMlab Project and for the dataset to test the Varian Cary Eclipse fluorometer and the Agilent 8453 spectrophotometer
- thanks to L. Fernández Galcerán (Laboratory of Chemical and Environmental Engineering, LEQUIA) for the feedback with the EEMlab loading procedure for standard CSV formatted EEMs
References
- Murphy KR, Stedmon CA, Graeber D, Bro R. (2013). «Fluorescence spectroscopy and multi-way techniques. PARAFAC». Analytical Methods 5, 6557-6566. DOI:10.1039/c3ay41160e
- Department of Food Science, Faculty of Science, University of Copenhagen, «The drEEM toolbox for MATLAB», 2017
- P. Micó, S. García-Ballesteros, M. Mora, R. Vicente, A.M. Amat, A. Arques, «EEMlab: A graphical user-friendly interface for fluorimetry experiments based on the drEEM toolbox», Chemometrics and Intelligent Laboratory Systems, vol. 188, 6-13. DOI: 10.1016/j.chemolab.2019.03.001