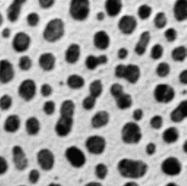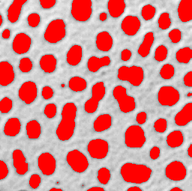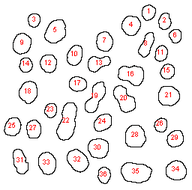
This is our first experiment just to test our software IDE composed by ImageJ (image processing) and Matlab (statistical analysis). It is supposed that the reader knows the basics about how to operate with both ImageJ and Matlab‘s software.
Sample presentation & image capture
ImageJ is installed with sample images by default. To illustrate this example we use the ‘Blobs’ sample image (‘File–>Open samples–>Blobs‘).
Now we just want to highlight some key points of this process.

Image processing (feature extraction)
To carry on with the image processing we use ImageJ. Steps to follow are:
- RGB to grayscale conversion: that is important to fix later a good threshold that separates objects (blobs) from background. You can achieve this clicking on ‘Image–>Type–>8-bit’
- Setting scale (‘Analyze–>Set scale’): if you know the equivalence between pixels and objects’ width this is a good policy to get the results (features) in terms of distances and not in pixels. In this example we suppose that a standard cell is 20 pixels are equivalent to 8 microns
- Threshold setting: in order to differentiate objects from background (‘Image–>Adjust–>Threshold’). Keep your attention on having your objects coloured in red. That means that red color is used to label your selection. Otherwise (background in red, objects grayscaled) you will get features from the background (and not from the blobs). When apply threshold the image becomes BW

- Setting measurements (‘Analyze–>Set Measurements’): where you define the features to be extracted in the later image processing. Area, shape descriptors, centroid or perimeter are commonly selected. In addition we also have gray-value parameters (for a 3D analysis) and other statistical estimators (median, kurtosis, etc.)
- Feature extraction (‘Analyze–>Analyze particles’): is the image processing step that isolates the objects and gets measuremets from each one of them. We have a wide list of options and possibilities to configure the processing (outlines, labels, exclude objects on edges…). At the end of the processing we get a list with the objects’ features. This list can be saved in Excel format and imported into Matlab for a later statistical analysis